
Impact of Prenatal Alcohol Exposure on the Development and Myocardium of Adult Mice: Morphometric Changes, Transcriptional Modulation of Genes Related to Cardiac Dysfunction, and Antioxidant Cardioprotection
 , ,
, ,  and
and 
Abstract
:1. Introduction
2. Materials and Methods
2.1. Animals
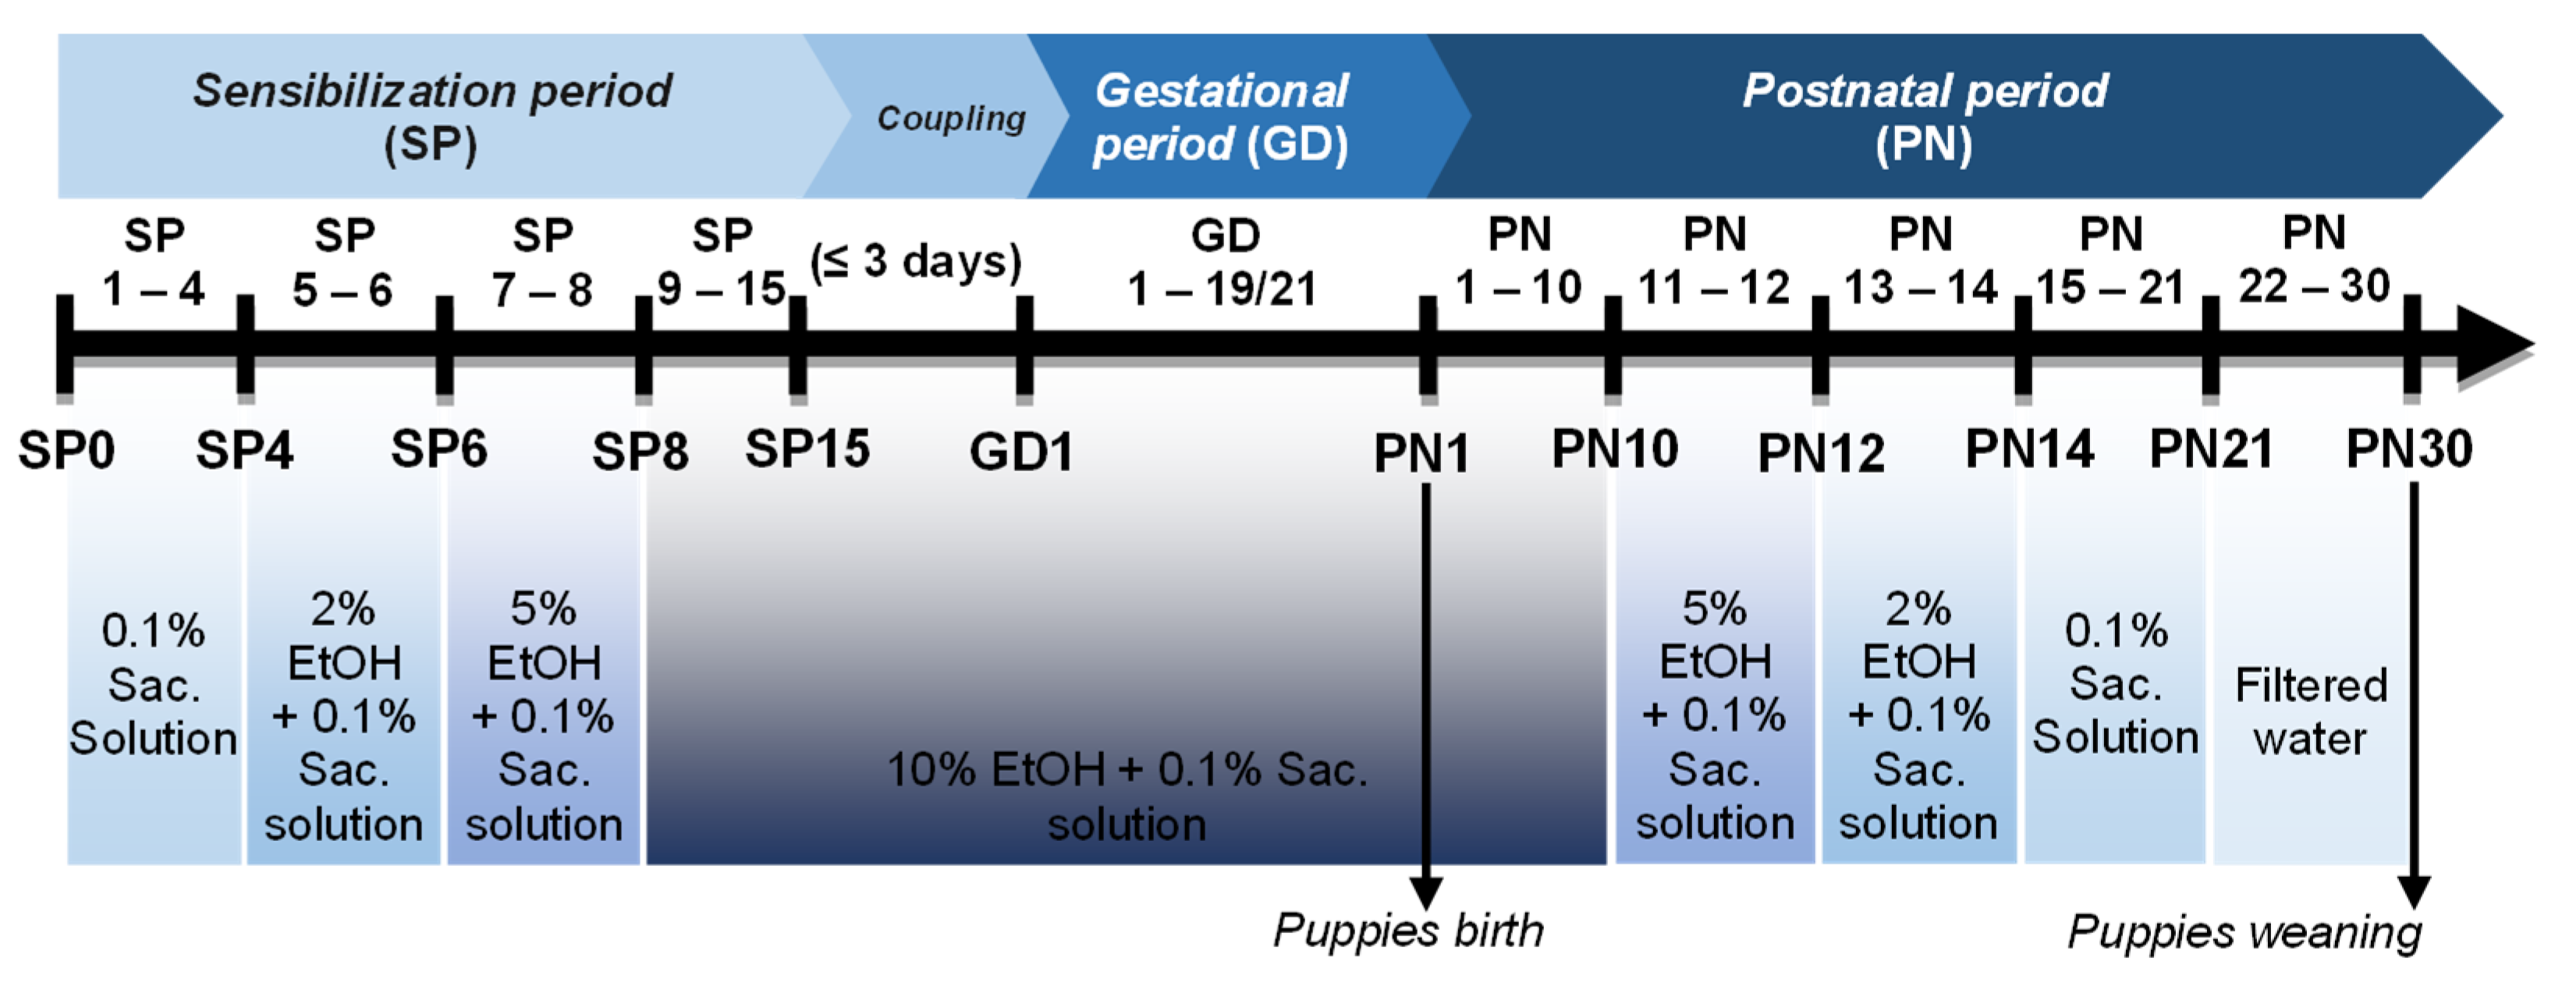
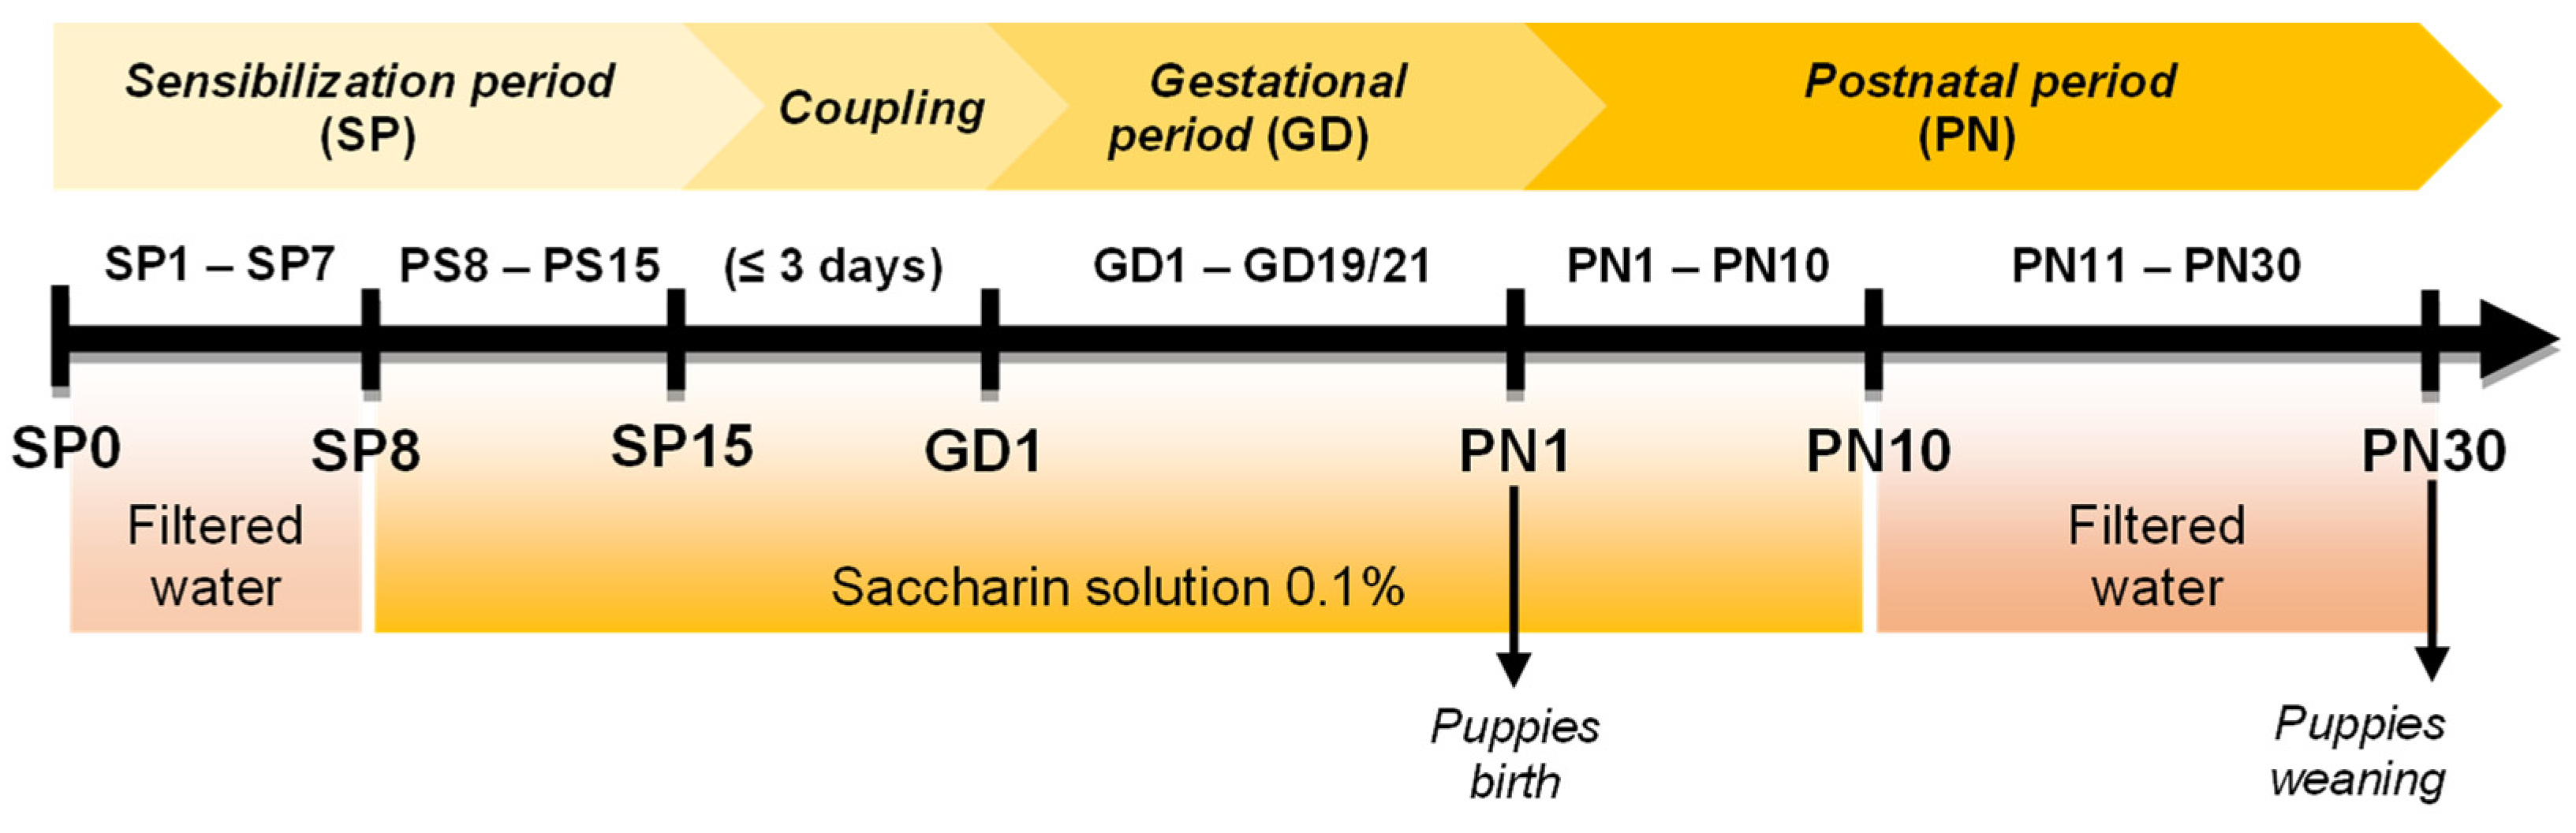
2.2. PAE Protocol
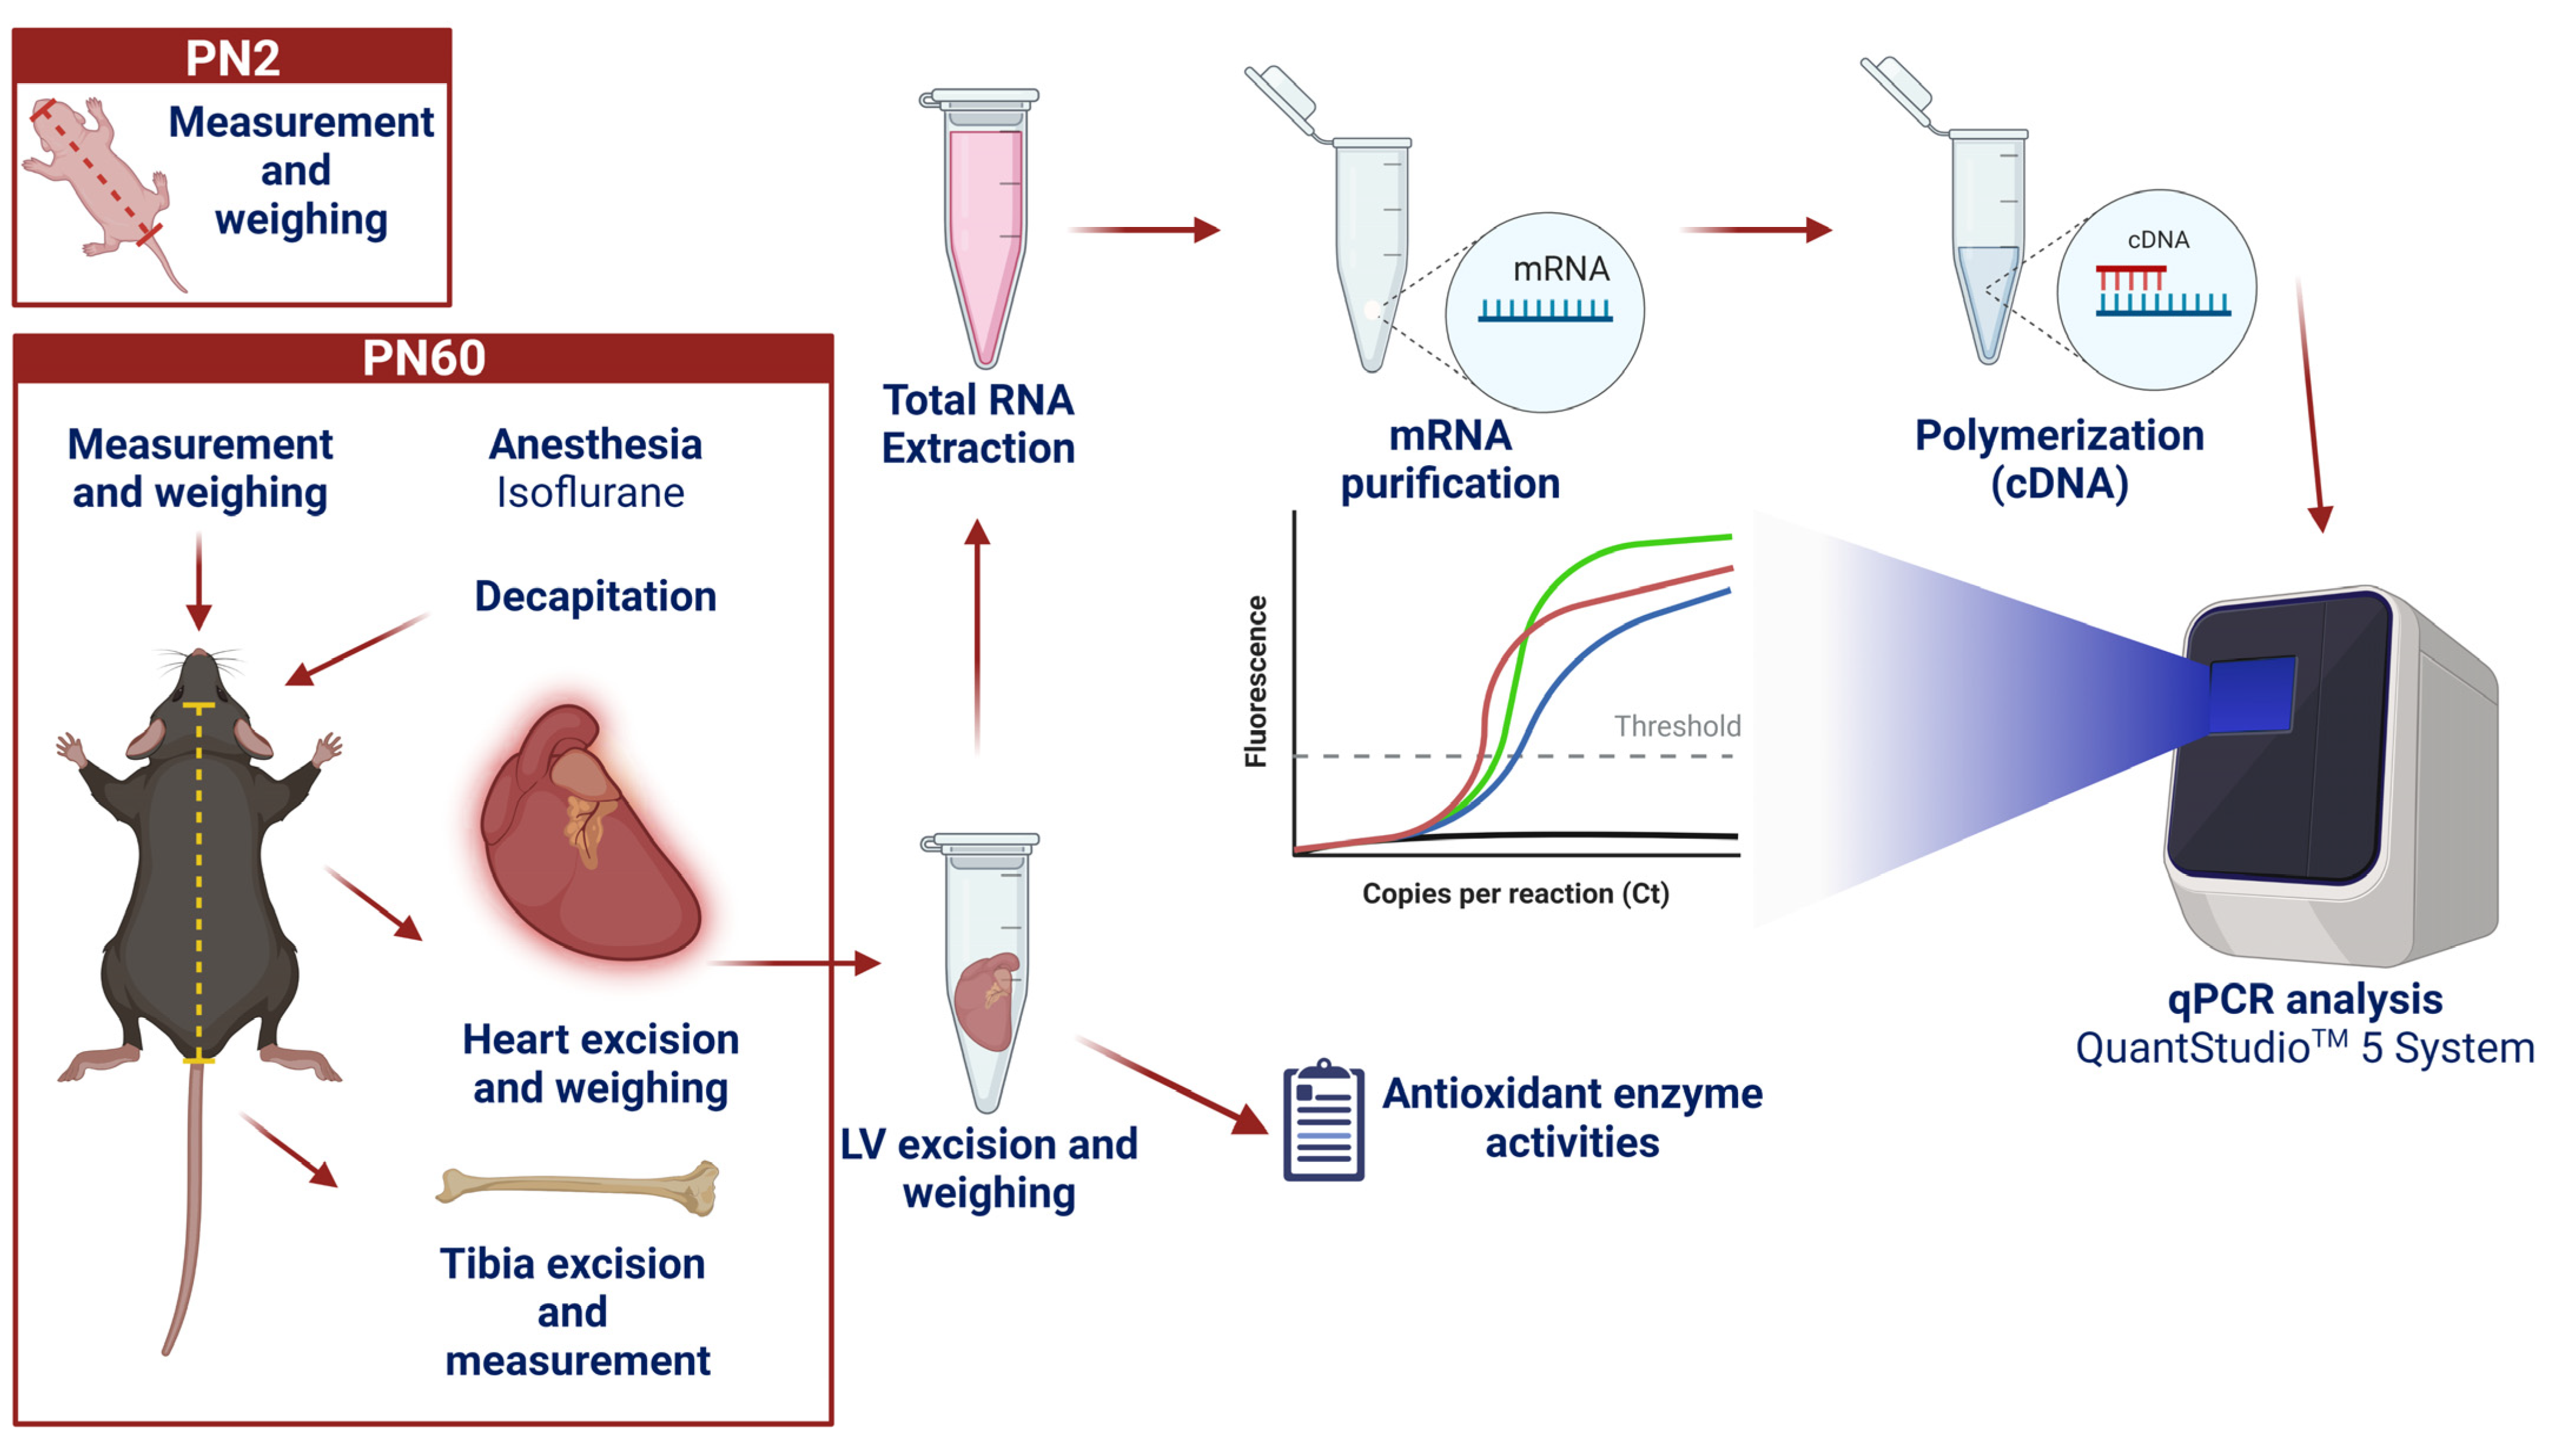
2.3. Biological Samples and Morphometric Measurements
2.4. Quantitative PCR
2.4.1. RNA Extraction
2.4.2. Reverse Transcription
2.4.3. Quantitative Real-Time Polymerization Chain Reaction (PCR)—qPCR
2.5. Antioxidant Enzymes Activities
2.6. Statistical Analysis
3. Results
4. Discussion
5. Conclusions
Supplementary Materials
Author Contributions
Funding
Institutional Review Board Statement
Informed Consent Statement
Data Availability Statement
Acknowledgments
Conflicts of Interest
References
- Baptista, F.H.; Rocha, K.B.B.; Martinelli, J.L.; Avó, L.R.S.; Ferreira, R.A.; Germano, C.M.R.; Melo, D.G. Prevalence and factors associated with alcohol consumption during pregnancy. Rev. Bras. Saúde Mat. Inf. 2017, 17, 271–279. [Google Scholar] [CrossRef] [Green Version]
- Sessa, F.; Salerno, M.; Esposito, M.; Di Nunno, N.; Li Rosi, G.; Roccuzzo, S.; Pomara, C. Understanding the Relationship between Fetal Alcohol Spectrum Disorder (FASD) and Criminal Justice: A Systematic Review. Healthcare 2022, 10, 84. [Google Scholar] [CrossRef] [PubMed]
- Mela, M. The Blind Spot of Medico-Legal Implications of Prenatal Alcohol Exposure. J. Am. Acad. Psychiatry Law Online 2022, 50, 509–516. [Google Scholar]
- Popova, S.; Lange, S.; Probst, C.; Gmel, G.; Rehm, J. Estimation of national, regional, and global prevalence of alcohol use during pregnancy and fetal alcohol syndrome: A systematic review and meta-analysis. Lancet Glob. Health 2017, 5, E290–E299. [Google Scholar] [CrossRef] [PubMed] [Green Version]
- Liu, F.; Zhou, J.; Guo, J.; Huang, W.; Zhang, W.; Wang, H. Prenatal ethanol exposure increases maternal bile acids through placental transport pathway. Toxicology 2021, 458, 152848. [Google Scholar] [CrossRef]
- Chen, Z.; Li, S.; Guo, L.; Peng, X.; Liu, Y. Prenatal alcohol exposure-induced congenital heart diseases: From bench to bedside. Birth Defects Res. 2021, 113, 521–534. [Google Scholar] [CrossRef]
- Zhang, S.; Wang, L.; Yang, T.; Chen, L.; Zhao, L.; Wang, T.; Chen, L.; Ye, Z.; Zheng, Z.; Qin, J. Parental alcohol consumption and the risk of congenital heart diseases in offspring: An updated systematic review and meta-analysis. Eur. J. Prev. Cardiol. 2020, 27, 410–421. [Google Scholar] [CrossRef]
- Ninh, V.K.; El Hajj, E.C.; Mouton, A.J.; Gardner, J.D. Prenatal Alcohol Exposure Causes Adverse Cardiac Extracellular Matrix Changes and Dysfunction in Neonatal Mice. Cardiovasc. Toxicol. 2019, 19, 389–400. [Google Scholar] [CrossRef]
- Rehm, J.; Gmel, G.E.S.; Gmel, G.; Hasan, O.S.M.; Imtiaz, S.; Popova, S.; Probst, C.; Roerecke, M.; Room, R.; Samokhvalov, A.V.; et al. The relationship between different dimensions of alcohol use and the burden of disease-an update. Addiction 2017, 112, 968–1001. [Google Scholar] [CrossRef] [Green Version]
- Gilbert-Barness, E. Review: Teratogenic Causes of Malformations. Ann. Clin. Lab. Sci. 2010, 40, 99–114. [Google Scholar]
- Rojmahamongkol, P.; Cheema-Hasan, A.; Weitzman, C. Do pediatricians recognize fetal alcohol spectrum disorders in children with developmental and behavioral problems? J. Dev. Behav. Pediatr. 2015, 36, 197–202. [Google Scholar] [CrossRef] [PubMed]
- Reid, N.; Shanley, D.C.; Logan, J.; White, C.; Liu, W.; Hawkins, E. International Survey of Specialist Fetal Alcohol Spectrum Disorder Diagnostic Clinics: Comparison of Diagnostic Approach and Considerations Regarding the Potential for Unification. Int. J. Environ. Res. Public Health 2022, 19, 15663. [Google Scholar] [CrossRef] [PubMed]
- Serano, M.; Han, M.; Brinez, P.; Linask, K.K. Fetal alcohol syndrome: Cardiac birth defects in mice and prevention with folate. Am. J. Obstetr. Gynecol. 2010, 203, E7–E75. [Google Scholar] [CrossRef] [PubMed]
- Shen, L.; Xie, L.; Chen, L.; Liu, L.; Shi, X.; Wang, X.; Chen, D.; Wang, H.; Quan, S.; Wang, Z. Resveratrol reverses the programmed high-susceptibility to non-alcoholic fatty liver disease by targeting the hepatic SIRT1-SREBP1c pathway in prenatal ethanol-exposed rat offspring. J. Toxicol. Sci. 2021, 46, 413–423. [Google Scholar] [CrossRef]
- Richardson, H.N.; Lee, S.Y.; O’Dell, L.E.; Koob, G.F.; Rivier, C.L. Alcohol self-administration acutely stimulates the hypothalamic-pituitary-adrenal axis, but alcohol dependence leads to a dampened neuroendocrine state. Eur. J. Neurosci. 2008, 28, 1641–1653. [Google Scholar] [CrossRef] [Green Version]
- Maschke, J.; Roetner, J.; Bösl, S.; Plank, A.C.; Rohleder, N.; Goecke, T.W.; Fasching, P.A.; Beckmann, M.W.; Kratz, O.; Moll, G.H.; et al. Association of Prenatal Alcohol Exposure and Prenatal Maternal Depression with Offspring Low-Grade Inflammation in Early Adolescence. Int. J. Environ. Res. Public Health 2021, 18, 7920. [Google Scholar] [CrossRef]
- Nguyen, T.M.T.; Steane, S.E.; Moritz, K.M.; Akison, L.K. Prenatal alcohol exposure programmes offspring disease: Insulin resistance in adult males in a rat model of acute exposure. J. Physiol. 2019, 597, 5619–5637. [Google Scholar] [CrossRef]
- Brocardo, P.S.; Gil-Mohapel, J.; Christie, B.R. The role of oxidative stress in fetal alcohol spectrum disorders. Brain Res. Rev. 2011, 67, 209–225. [Google Scholar] [CrossRef]
- Ponnappa, B.C.; Rubin, E. Modeling alcohol’s effects on organs in animal models. Alcohol Res. Health 2000, 24, 93–104. [Google Scholar]
- Parkington, H.C.; Coleman, H.A.; Wintour, E.M.; Tare, M. Prenatal alcohol exposure: Implications for cardiovascular function in the fetus and beyond. Clin. Exp. Pharmacol. Physiol. 2010, 37, e91–e98. [Google Scholar] [CrossRef]
- Gray, S.P.; Denton, K.M.; Cullen-Mcewen, L.; Bertram, J.F.; Moritz, K.M. Prenatal exposure to alcohol reduces nephron number and raises blood pressure in progeny. J. Am. Soc. Nephrol. 2010, 21, 1891–1902. [Google Scholar] [CrossRef] [PubMed] [Green Version]
- Akers, K.G.; Kushner, S.A.; Leslie, A.T.; Clarke, L.; van der Kooy, D.; Lerch, J.P.; Frankland, P.W. Fetal alcohol exposure leads to abnormal olfactory bulb development and impaired odor discrimination in adult mice. Mol. Brain 2011, 4, 2–15. [Google Scholar] [CrossRef] [PubMed] [Green Version]
- Allan, A.M.; Chynoweth, J.; Tyler, L.A.; Caldwell, K.K. A mouse model of prenatal ethanol exposure using a voluntary drinking paradigm. Alcohol Clin. Exp. Res. 2003, 27, 2009–2016. [Google Scholar] [CrossRef] [PubMed]
- Yin, F.C.; Spurgeon, H.A.; Rakusan, K.; Weisfeldt, M.L.; Lakatta, E.G. Use of tibial length to quantify cardiac hypertrophy: Application in the aging rat. Am. J. Physiol. 1982, 243, 941–947. [Google Scholar] [CrossRef]
- Feliciano, R.D.S.; Atum, A.L.B.; Ruiz, É.G.D.S.; Serra, A.J.; Antônio, E.L.; Manchini, M.T.; Silva, J.M.A.; Tucci, P.J.F.; Nathanson, L.; Morris, M.; et al. Photobiomodulation Therapy on Myocardial Infarction in Rats: Transcriptional and Posttranscriptional Implications to Cardiac Remodeling. Lasers Surg. Med. 2021, 53, 1247–1257. [Google Scholar] [CrossRef]
- Kalter, H. Teratology in the 20th century: Environmental causes of congenital malformations in humans and how they were established. Neurotoxicol. Teratol. 2003, 25, 131–282. [Google Scholar] [CrossRef]
- Petrelli, B.; Weinberg, J.; Hicks, G.G. Effects of prenatal alcohol exposure (P.A.E.): Insights into FASD using mouse models of PAE. Biochem. Cell Biol. 2018, 96, 131–147. [Google Scholar] [CrossRef]
- Goodlett, C.R.; Horn, K.H.; Zhou, F.C. Alcohol Teratogenesis: Mechanisms of Damage and Strategies for Intervention. Exp. Biol. Med. 2005, 230, 394–406. [Google Scholar] [CrossRef]
- Vasan, R.S. Biomarkers of cardiovascular disease: Molecular basis and practical considerations. Circulation 2006, 113, 2335–2362. [Google Scholar] [CrossRef]
- Turcotte, L.A.; Aberle, N.S.; Norby, F.L.; Wang, G.J.; Ren, J. Influence of prenatal ethanol exposure on vascular contractile response in rat thoracic aorta. Alcohol 2002, 26, 75–81. [Google Scholar] [CrossRef]
- Hocher, B. Fetal programming of cardiovascular diseases in later life—Mechanisms beyond maternal undernutrition. J. Physiol. 2007, 579, 287–288. [Google Scholar] [CrossRef] [PubMed]
- Huang, I.; Mak, D.; Cheung, P.; Abraham, M.; Clemens, T.; Turner, S. A systematic review of associations between maternal exposures during pregnancy other than smoking and antenatal fetal measurements. Environ. Res. 2019, 173, 528–538. [Google Scholar] [CrossRef] [PubMed] [Green Version]
- Nykjaer, C.; Alwan, N.A.; Greenwood, D.C.; Simpson, N.A.; Hay, A.W.; White, K.L.; Cade, J.E. Maternal alcohol intake prior to and during pregnancy and risk of adverse birth outcomes: Evidence from a British cohort. J. Epidemiol. Community Health 2017, 68, 542–549. [Google Scholar] [CrossRef] [PubMed]
- Tseng, A.M.; Mahnke, A.H.; Wells, A.B.; Salem, N.A.; Allan, A.M.; Roberts, V.H.; Newman, N.; Walter, N.A.; Kroenke, C.D.; Grant, K.A.; et al. Collaborative Initiative on Fetal Alcohol Spectrum Disorders. Maternal circulating miRNAs that predict infant FASD outcomes influence placental maturation. Life Sci Alliance 2019, 2, e201800252. [Google Scholar] [CrossRef] [PubMed] [Green Version]
- Patra, J.; Bakker, R.; Irving, H.; Jaddoe, V.W.; Malini, S.; Rehm, J. Dose-response relationship between alcohol consumption before and during pregnancy and the risks of low birthweight, preterm birth and small for gestational age (SGA)-a systematic review and meta-analyses. BJOG 2011, 118, 1411–1421. [Google Scholar] [CrossRef] [PubMed] [Green Version]
- Uban, K.A.; Comeau, W.L.; Ellis, L.A.; Galea, L.A.; Weinberg, J. Basal regulation of HPA and dopamine systems is altered differentially in males and females by prenatal alcohol exposure and chronic variable stress. Psychoneuroendocrinology 2013, 38, 1953–1966. [Google Scholar] [CrossRef] [Green Version]
- Walton, S.L.; Tjongue, M.; Tare, M.; Kwok, E.; Probyn, M.; Parkington, H.C.; Bertram, J.F.; Moritz, K.M.; Denton, K.M. Chronic low alcohol intake during pregnancy programs sex-specific cardiovascular deficits in rats. Biol. Sex Differ. 2019, 10, 21. [Google Scholar] [CrossRef] [Green Version]
- Krasemann, T.; Klingebiel, S. Influence of chronic intrauterine exposure to alcohol on structurally normal hearts. Cardiol. Young 2007, 17, 185–188. [Google Scholar] [CrossRef]
- Paoletti, E.; Specchia, C.; Di Maio, G.; Bellino, D.; Damasio, B.; Cassottana, P.; Cannella, G. The worsening of left ventricular hypertrophy is the strongest predictor of sudden cardiac death in haemodialysis patients: A 10 year survey. Nephrol. Dial. Transplant 2004, 19, 1829–1834. [Google Scholar] [CrossRef]
- Ren, J.; Wold, L.E.; Natavio, M.; Ren, B.H.; Hannigan, J.H.; Brown, R.A. Influence of prenatal alcohol exposure on myocardial contractile function in adult rat hearts: Role of intracellular calcium and apoptosis. Alcohol Alcohol. 2002, 37, 30–37. [Google Scholar] [CrossRef] [Green Version]
- Knowles, J.W.; Esposito, G.; Mao, L.; Hagaman, J.R.; Fox, J.E.; Smithies, O.; Rockman, H.A.; Maeda, N. Pressure-independent enhancement of cardiac hypertrophy in natriuretic peptide receptor A-deficient mice. J. Clin. Investig. 2001, 107, 975–984. [Google Scholar] [CrossRef] [PubMed] [Green Version]
- Fu, S.; Ping, P.; Zhu, Q.; Ye, P.; Luo, L. Brain Natriuretic Peptide and Its Biochemical, Analytical, and Clinical Issues in Heart Failure: A Narrative Review. Front. Physiol. 2018, 9, 692. [Google Scholar] [CrossRef] [PubMed]
- Cea, L.B. Natriuretic peptide family: New aspects. Curr. Med. Chem. Cardiovasc. Hematol. Agents 2005, 3, 87–98. [Google Scholar] [CrossRef] [PubMed]
- Silva, J.A., Jr.; Araujo, R.C.; Baltatu, O.; Oliveira, S.M.; Tschöpe, C.; Fink, E.; Hoffmann, S.; Plehm, R.; Chai, K.X.; Chao, L.; et al. Reduced cardiac hypertrophy and altered blood pressure control in transgenic rats with the human tissue kallikrein gene. FASEB J. 2000, 14, 1858–1860. [Google Scholar] [CrossRef] [Green Version]
- Marcus, L.S.; Hart, D.; Packer, M.; Yushak, M.; Medina, N.; Danziger, R.S.; Heitjan, D.F.; Katz, S.D. Hemodynamic and renal excretory effects of human brain natriuretic peptide infusion in patients with congestive heart failure. A double-blind, placebo-controlled, randomized crossover trial. Circulation 1996, 94, 3184–3189. [Google Scholar] [CrossRef]
- Nishikimi, T.; Kuwahara, K.; Nakao, K. Current biochemistry, molecular biology, and clinical relevance of natriuretic peptides. J. Cardiol. 2011, 57, 131–140. [Google Scholar] [CrossRef] [Green Version]
- Cataliotti, A.; Tonne, J.M.; Bellavia, D.; Martin, F.L.; Oehler, E.A.; Harders, G.E.; Campbell, J.M.; Peng, K.W.; Russell, S.J.; Malatino, L.S.; et al. Long-term cardiac pro-B-type natriuretic peptide gene delivery prevents the development of hypertensive heart disease in spontaneously hypertensive rats. Circulation 2011, 123, 1297–1305. [Google Scholar] [CrossRef]
- Tirapelli, C.R.; Casolari, D.A.; Montezano, A.C.; Yogi, A.; Tostes, R.C.; Legros, E.; D’Orléans-Juste, P.; Lanchote, V.L.; Uyemura, S.A.; de Oliveira, A.M. Ethanol consumption enhances endothelin-1-induced contraction in the isolated rat carotid. J. Pharmacol. Exp. Ther. 2006, 318, 819–827. [Google Scholar] [CrossRef] [Green Version]
- Tan, Y.; Li, X.; Prabhu, S.D.; Brittian, K.R.; Chen, Q.; Yin, X.; McClain, C.J.; Zhou, Z.; Cai, L. Angiotensin II plays a critical role in alcohol-induced cardiac nitrative damage, cell death, remodeling, and cardiomyopathy in a protein kinase C/nicotinamide adenine dinucleotide phosphate oxidase-dependent manner. J. Am. Coll. Cardiol. 2012, 59, 1477–1486. [Google Scholar] [CrossRef] [Green Version]
- Morkin, E. Regulation of myosin heavy chain genes in the heart. Circulation 1993, 87, 1451–1460. [Google Scholar] [CrossRef] [PubMed] [Green Version]
- Brittsan, A.G.; Kranias, E.G. Phospholamban and cardiac contractile function. J. Mol. Cell Cardiol. 2000, 32, 2131–2139. [Google Scholar] [CrossRef]
- Chen, D.B.; Wang, L.; Wang, P.H. Insulin-like growth factor I retards apoptotic signaling induced by ethanol in cardiomyocytes. Life Sci. 2000, 67, 1683–1693. [Google Scholar] [CrossRef] [PubMed]
- Goh, J.M.; Bensley, J.G.; Kenna, K.; Sozo, F.; Bocking, A.D.; Brien, J.; Walker, D.; Harding, R.; Black, M.J. Alcohol exposure during late gestation adversely affects myocardial development with implications for postnatal cardiac function. Am. J. Physiol. Heart Circ. Physiol. 2011, 300, H645–H651. [Google Scholar] [CrossRef] [PubMed]
- Connor, B.; Beilharz, E.J.; Williams, C.; Synek, B.; Gluckman, P.D.; Faull, R.L.; Dragunow, M. Insulin-like growth factor-I (IGF-I) immunoreactivity in the Alzheimer’s disease temporal cortex and hippocampus. Brain Res. Mol. Brain Res. 1997, 49, 283–290. [Google Scholar] [CrossRef] [PubMed]
- Guan, J.; Bennet, L.; Gluckman, P.D.; Gunn, A.J. Insulin-like growth factor-1 and post-ischemic brain injury. Prog. Neurobiol. 2003, 70, 443–462. [Google Scholar] [CrossRef]
- Ila, R.; Solem, M. Chronic-alcohol exposure alters IGF1 signaling in H9c2 cells via changes in PKC delta. Alcohol 2006, 39, 169–178. [Google Scholar] [CrossRef] [Green Version]
- Newton, P.M.; Ron, D. Protein kinase C and alcohol addiction. Pharmacol. Res. 2007, 55, 570–577. [Google Scholar] [CrossRef]
- Stubbs, C.D.; Slater, S.J. Ethanol and protein kinase C. Alcohol Clin. Exp. Res. 1999, 23, 1552–1560. [Google Scholar] [CrossRef]
- Molkentin, J.D. Calcineurin-NFAT signaling regulates the cardiac hypertrophic response in coordination with the MAPKs. Cardiovasc. Res. 2004, 63, 467–475. [Google Scholar] [CrossRef]
- Wang, Y. Mitogen-activated protein kinases in heart development and diseases. Circulation 2007, 116, 1413–1423. [Google Scholar] [CrossRef] [Green Version]
- Qi, M.; Elion, E.A. MAP kinase pathways. J. Cell Sci. 2005, 118 Pt 16, 3569–3572. [Google Scholar] [CrossRef] [Green Version]
- Okada, H.; Takemura, G.; Kosai, K.; Li, Y.; Takahashi, T.; Esaki, M.; Yuge, K.; Miyata, S.; Maruyama, R.; Mikami, A.; et al. Postinfarction gene therapy against transforming growth factor-beta signal modulates infarct tissue dynamics and attenuates left ventricular remodeling and heart failure. Circulation 2005, 111, 2430–2437. [Google Scholar] [CrossRef] [PubMed]
- Yabluchanskiy, A.; Ma, Y.; Iyer, R.P.; Hall, M.E.; Lindsey, M.L. Matrix metalloproteinase-9: Many shades of function in cardiovascular disease. Physiology 2013, 28, 391–403. [Google Scholar] [CrossRef] [PubMed]
- Drever, N.; Yin, H.; Kechichian, T.; Costantine, M.; Longo, M.; Saade, G.R.; Bytautiene, E. The expression of antioxidant enzymes in a mouse model of fetal alcohol syndrome. Am. J. Obstet. Gynecol. 2012, 206, e19–e22. [Google Scholar] [CrossRef] [Green Version]
- Shirpoor, A.; Gaderi, R.; Naderi, R. Ethanol exposure in prenatal and early postnatal induced cardiac injury in rats: Involvement of oxidative stress, Hsp70, ERK 1/2, JNK, and apoptosis in a 3-month follow-up study. Cell Stress. Chaperones. 2019, 24, 917–926. [Google Scholar] [CrossRef] [PubMed]
- Pautassi, R.M.; Camarini, R.; Quadros, I.M.; Miczek, K.A.; Israel, Y. Genetic and environmental influences on ethanol consumption: Perspectives from preclinical research. Alcohol Clin. Exp. Res. 2010, 34, 976–987. [Google Scholar] [CrossRef] [PubMed]
- Silva, G.A.; Atum, A.L.B.; Matos, L.P.; Nasuk, G.R.; Calixto, B.J.; Gouveia, T.l.F.; Baltatu, O.C.; Zamunner, S.R.; Silva, J.A., Jr. Prenatal alcohol exposure induces myocardial and hippocampal sex-related differences in gene expression of vasoactive peptides of renin-angiotensin and kallikrein-kinin systems and modulation of oxidative stress in adult offspring. Antioxidants 2022. [Google Scholar]


| Maternal Data | Control | PAE | p Value |
|---|---|---|---|
| Daily consumption (mL/day) | 10.63 ± 0.13 | 9.74 ± 0.33 | 0.121 |
| Number of litters | 10 | 16 | |
| Number of puppies | 78 | 113 | |
| Average litter size | 7.8 ± 0.25 | 7.1 ± 0.46 | 0.245 |
| Total death | 24 | 61 | |
| Death per litter | 2.4 ± 0.64 | 3.8 ± 0.80 | 0.223 |
| Gene | Control | PAE | p Value |
|---|---|---|---|
| Akt1 | 1.0 | 3.1 ± 0.12 * | <0.001 |
| Vegfa | 1.0 | 0.4 ± 0.02 * | <0.001 |
| Bax | 1.0 | 2.7 ± 0.05 * | <0.001 |
| Fas | 1.0 | 1.1 ± 0.05 | 0.1170 |
| Mapk1 | 1.0 | 2.2 ± 0.05 * | <0.001 |
| Mapk14 | 1.0 | 5.1 ± 0.05 * | <0.001 |
| Tp53 | 1.0 | 1.8 ± 0.03 * | <0.001 |
| Atp2a2 | 1.0 | 3.6 ± 0.07 * | <0.001 |
| Casq2 | 1.0 | 0.4 ± 0.02 * | <0.001 |
| Pln | 1.0 | 3.0 ± 0.15 * | <0.001 |
| RyR-2 | 1.0 | 3.4 ± 0.16 * | <0.001 |
| Slc8a1 | 1.0 | 0.4 ± 0.04 * | <0.001 |
| Cat | 1.0 | 2.1 ± 0.18 * | <0.001 |
| Gpx4 | 1.0 | 2.5 ± 0.13 * | <0.001 |
| Hspa1a/b | 1.0 | 2.9 ± 0.24 * | <0.001 |
| Sod1 | 1.0 | 2.4 ± 0.05 * | <0.001 |
| Ace | 1.0 | 0.5 ± 0.01 * | <0.001 |
| Ace2 | 1.0 | 0.2 ± 0.02 * | <0.001 |
| Agtr1a | 1.0 | 0.2 ± 0.02 * | <0.001 |
| Cabin1 | 1.0 | 2.7 ± 0.17 * | <0.001 |
| Chp2 | 1.0 | 0.2 ± 0.05 * | <0.001 |
| Edn1 | 1.0 | 1.0 ± 0.12 | 0.511 |
| Igf1 | 1.0 | 2.2 ± 0.07 * | <0.001 |
| Map3k2 | 1.0 | 1.8 ± 0.04 * | <0.001 |
| Myh6 | 1.0 | 0.3 ± 0.01 * | <0.001 |
| Myh7 | 1.0 | 2.3 ± 0.13 * | <0.001 |
| Nfatc3 | 1.0 | 2.6 ± 0.05 * | <0.001 |
| Nppa | 1.0 | 3.6 ± 0.28 * | <0.001 |
| Nppb | 1.0 | 4.2 ± 0.16 * | <0.001 |
| Prkca | 1.0 | 2.8 ± 0.19 * | <0.001 |
| Prkcb | 1.0 | 3.1 ± 0.23 * | <0.001 |
| Prkcg | 1.0 | 2.3 ± 0.09 * | <0.001 |
| IL-6 | 1.0 | 3.0 ± 0.15 * | <0.001 |
| Tnfrsf1a | 1.0 | 2.7 ± 0.12 * | <0.001 |
| Tnf | 1.0 | 2.2 ± 0.10 * | <0.001 |
| Col1a1 | 1.0 | 1.7 ± 0.11 * | <0.001 |
| Col3a1 | 1.0 | 1.1 ± 0.07 | 0.3694 |
| Mmp9 | 1.0 | 3.8 ± 0.21 * | <0.001 |
| Tgfb1 | 1.0 | 3.8 ± 0.22 * | <0.001 |
| Tnc | 1.0 | 1.0 ± 0.03 | 0.3026 |
| Gapdh | 1.0 | 0.4 ± 0.06 * | <0.001 |
| Hk1 | 1.0 | 0.3 ± 0.02 * | <0.001 |
| Ndufa3 | 1.0 | 2.2 ± 0.09 * | <0.001 |
| Pfkm | 1.0 | 0.6 ± 0.03 * | <0.001 |
| Slc2a1 | 1.0 | 3.0 ± 0.11 * | <0.001 |
| Taz | 1.0 | 2.3 ± 0.07 * | <0.001 |
| Ucp-2 | 1.0 | 2.5 ± 0.04 * | <0.001 |
| Control | PAE | |
|---|---|---|
| SOD (U/mg protein) | 142.11 ± 27.45 | 199.20 ± 20.91 * |
| CAT (mol H2O2/min mg protein) | 23.50 ± 5.30 | 33.9 ± 3.14 * |
| GPx (nmol NADPH/mg protein/min) | 50.40 ± 19.26 | 89.6± 12.8 * |
Disclaimer/Publisher’s Note: The statements, opinions and data contained in all publications are solely those of the individual author(s) and contributor(s) and not of MDPI and/or the editor(s). MDPI and/or the editor(s) disclaim responsibility for any injury to people or property resulting from any ideas, methods, instructions or products referred to in the content. |
© 2023 by the authors. Licensee MDPI, Basel, Switzerland. This article is an open access article distributed under the terms and conditions of the Creative Commons Attribution (CC BY) license (https://creativecommons.org/licenses/by/4.0/).
Share and Cite
Atum, A.L.B.; de Matos, L.P.; de Jesus, B.C.; Nasuk, G.R.; da Silva, G.A.; Gomes, C.P.; Pesquero, J.B.; Zamuner, S.R.; Silva Júnior, J.A. Impact of Prenatal Alcohol Exposure on the Development and Myocardium of Adult Mice: Morphometric Changes, Transcriptional Modulation of Genes Related to Cardiac Dysfunction, and Antioxidant Cardioprotection. Antioxidants 2023, 12, 256. https://doi.org/10.3390/antiox12020256
Atum ALB, de Matos LP, de Jesus BC, Nasuk GR, da Silva GA, Gomes CP, Pesquero JB, Zamuner SR, Silva Júnior JA. Impact of Prenatal Alcohol Exposure on the Development and Myocardium of Adult Mice: Morphometric Changes, Transcriptional Modulation of Genes Related to Cardiac Dysfunction, and Antioxidant Cardioprotection. Antioxidants. 2023; 12(2):256. https://doi.org/10.3390/antiox12020256
Chicago/Turabian StyleAtum, Allan Luís Barboza, Leonardo Paroche de Matos, Bruna Calixto de Jesus, Guilherme Rabelo Nasuk, Gabriel Almeida da Silva, Caio Perez Gomes, João Bosco Pesquero, Stella Regina Zamuner, and José Antônio Silva Júnior. 2023. "Impact of Prenatal Alcohol Exposure on the Development and Myocardium of Adult Mice: Morphometric Changes, Transcriptional Modulation of Genes Related to Cardiac Dysfunction, and Antioxidant Cardioprotection" Antioxidants 12, no. 2: 256. https://doi.org/10.3390/antiox12020256